Tesla
Tesla Pitch Deck (2011)
Tesla filed this 15-slide investor presentation as Exhibit 99.1 with the SEC in December 2010 — the deck Elon Musk used to raise $192M from strategic partners Toyota, Panasonic, and Daimler. It breaks the classic pitch-deck playbook: team comes second, product does not appear until slide 8, and three full slides are dedicated to OEM partnerships with revenue charts. The story is not a startup asking for belief — it is a company showing Fortune 500 validation, 3,100 Model S reservations, and a $42M Fremont factory purchase on the path to mass production.
Stage · Strategic roundIndustry · Automotive
- Industry
- Automotive
- Business model
- Electric vehicles and powertrain supplier
- Raised
- $192M (2011 strategic round)
- Location
- Palo Alto, California
- Website
- tesla.com
Slide-by-slide breakdown
Slide 1: Cover
Red Tesla wordmark on white — 'Investor Presentation' subtitle, no tagline or imagery.
Minimal cover signals public-company seriousness, not startup flash. Two words do the job — investors already know why they're in the room.
Slide 2: Best of Silicon Valley and Auto
Twelve-person leadership grid — Musk, Straubel, von Holzhausen, Blankenship (Apple/Gap), Ahuja (Ford), and nine others with prior employer logos.
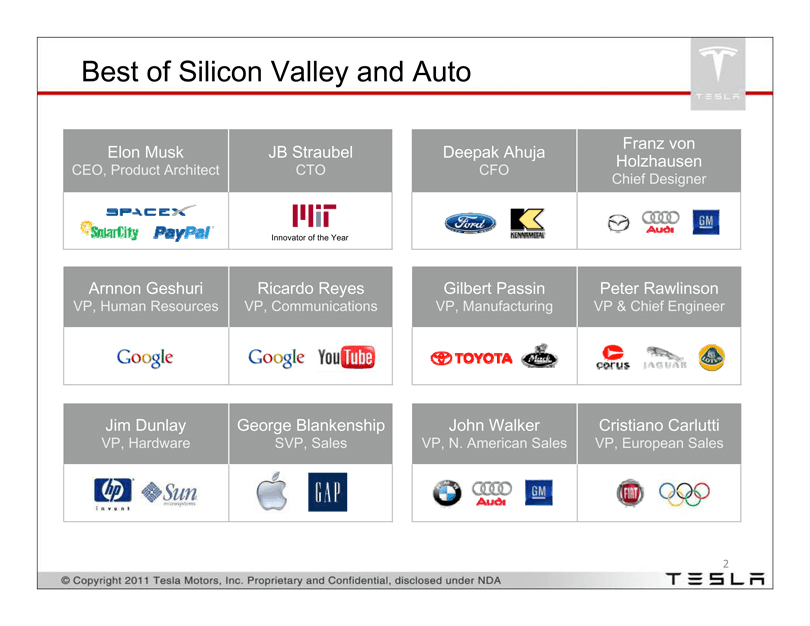
Team slide at position two is deliberate. Cross-industry pedigree (PayPal + Ford + Lotus + Apple retail) answers the 'can they actually build cars?' objection before product.
Slide 3: Engineering team growth
Stacked bar chart — engineering headcount grows from ~210 (Q1 2010) to ~440 (Q3 2010) across powertrain, vehicle, and manufacturing engineering.
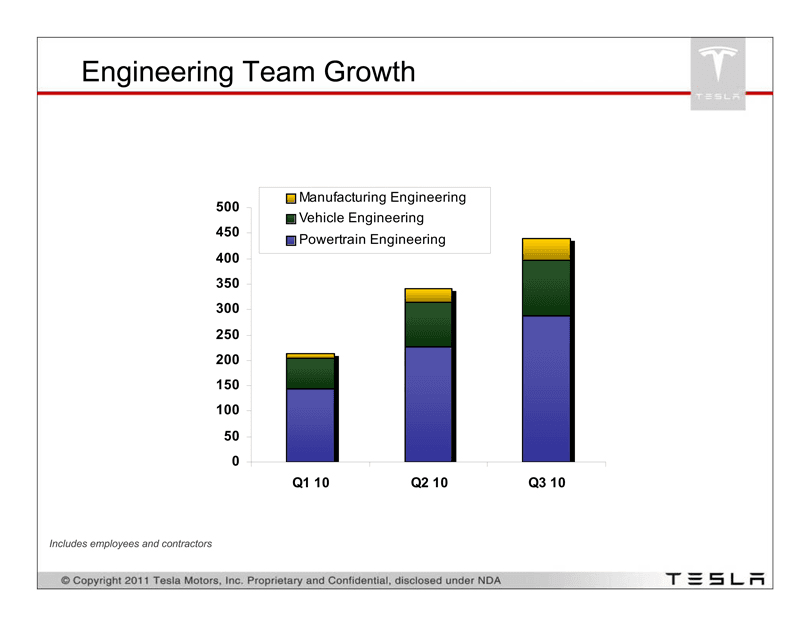
Hiring velocity as proof of execution. Splitting powertrain vs vehicle vs manufacturing shows depth, not just a single headcount number.
Slide 4: Toyota partnership
$50M IPO investment, $9M RAV4 EV prototype contract, $60M development contract for integrated powertrain, LA Auto Show prototype reveal.
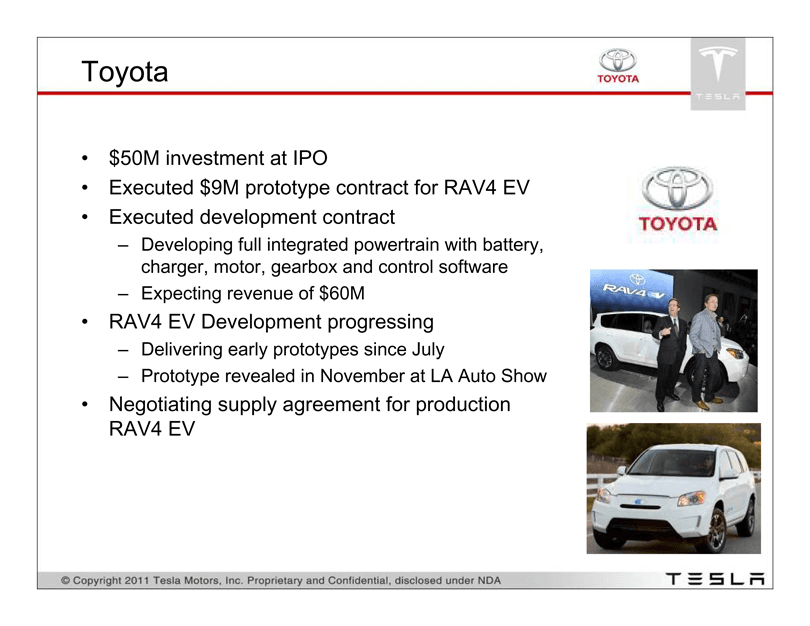
One slide, three revenue lines from the world's largest automaker. Photos of Musk with the RAV4 EV make the partnership tangible — not a press-release logo drop.
Slide 5: Panasonic partnership
$30M Q4 2010 investment, custom 18650 automotive cell in development, CTO quote: 'Tesla leads the auto battery pack industry.'
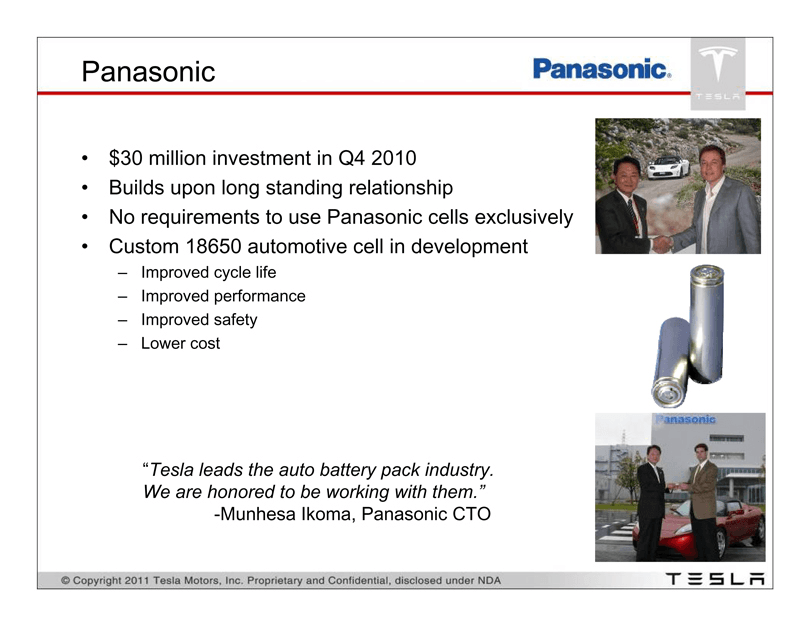
Competitor validation on your deck — Panasonic's CTO vouching for Tesla's battery leadership is rare social proof. Cell specs (cycle life, safety, cost) show technical depth.
Slide 6: Daimler partnership
1,500 Smart fortwo and 500 Mercedes A-Class EV orders; quarterly sales to Daimler chart rising from ~$3M to ~$12M across 2010.
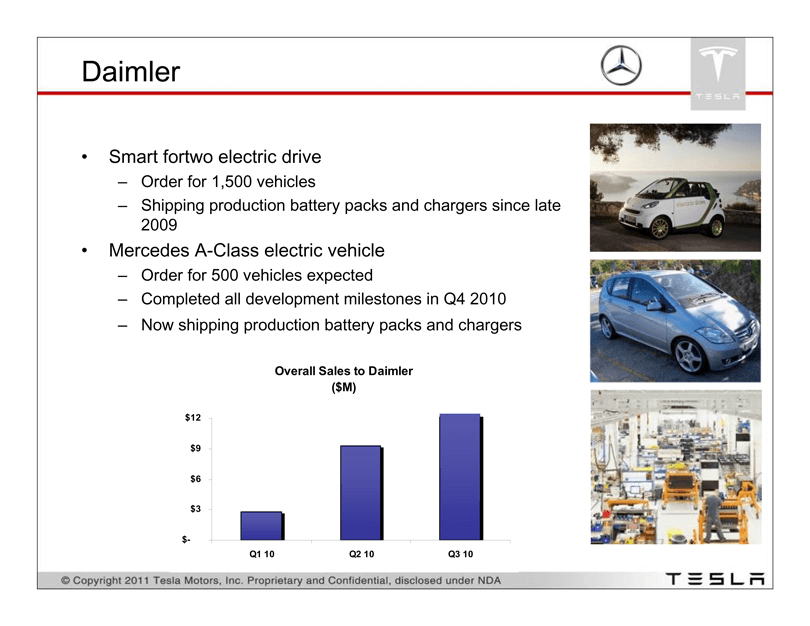
Revenue bar chart from a competitor OEM is the deck's killer metric. Shipping battery packs since 2009 proves Tesla is already a supplier, not just a car company.
Slide 7: Roadster leading the way
World map with store locations — 1,400+ Roadsters in 31 countries, 8M+ miles driven, new stores in Tokyo, Paris, Milan, Copenhagen, Newport Beach.
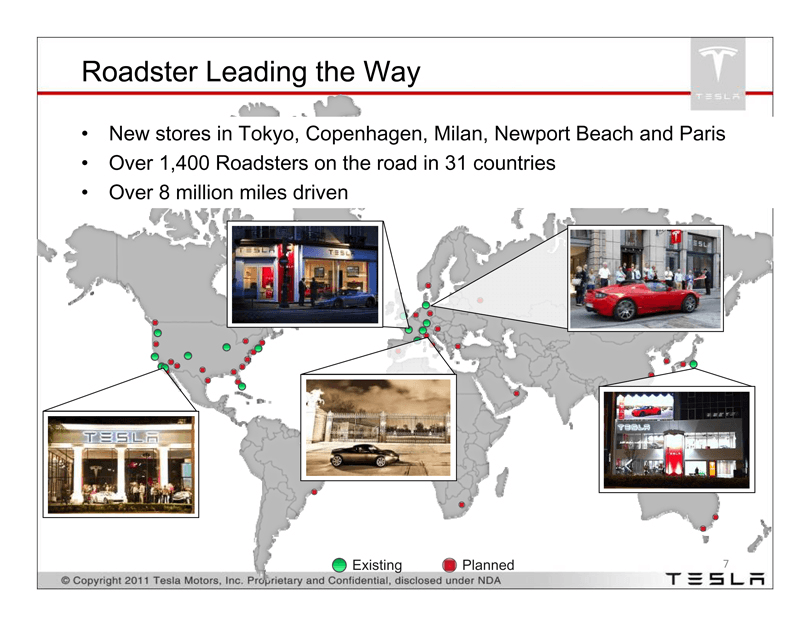
Global traction before the mass-market bet. Map + store photos show retail infrastructure investors can extrapolate to Model S rollout.
Slide 8: Model S
White Model S prototype photo — 20,000 units annually projected for 2013, ~1% of premium global market.
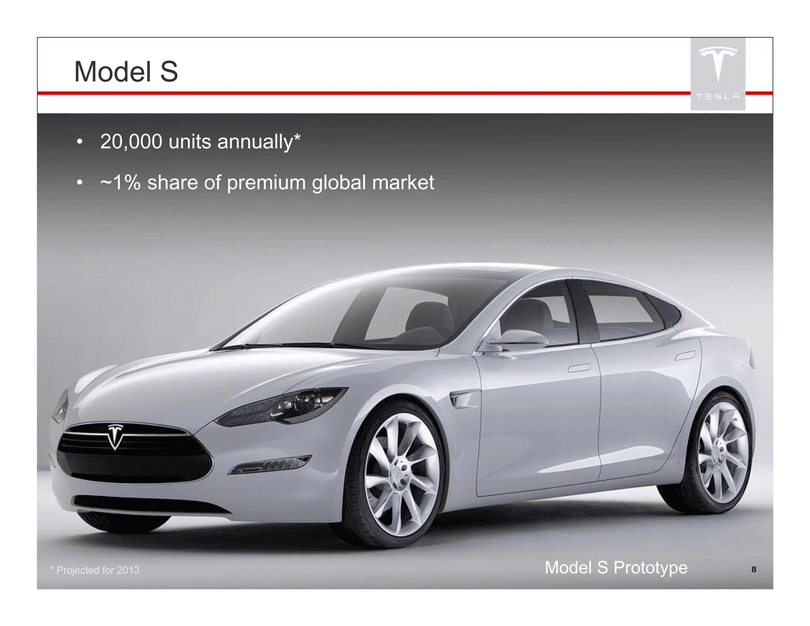
Product finally appears at slide 8 — after partnerships and traction. Volume target (20K/year) and market share framing keep ambition specific, not vague.
Slide 9: In a class of its own
Two-column spec sheet — features (17-inch touchscreen, 4G, apps platform, 5-star crash) and performance (300-mile range, 45-min charge, sub-6-second 0–60).
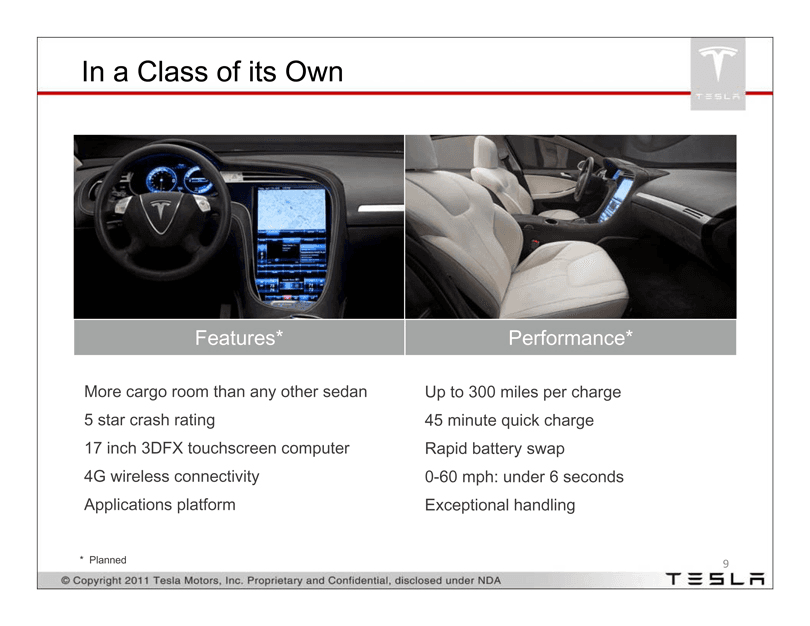
Interior photos plus planned specs sell the premium positioning. Mixing cargo room with software platform foreshadows Tesla's tech-company narrative.
Slide 10: Cumulative Model S reservations
Bar chart from Q1 2009 to Q3 2010 — reservations climb to ~3,100; footnote: sales team not actively pushing, $5,000 minimum deposit.
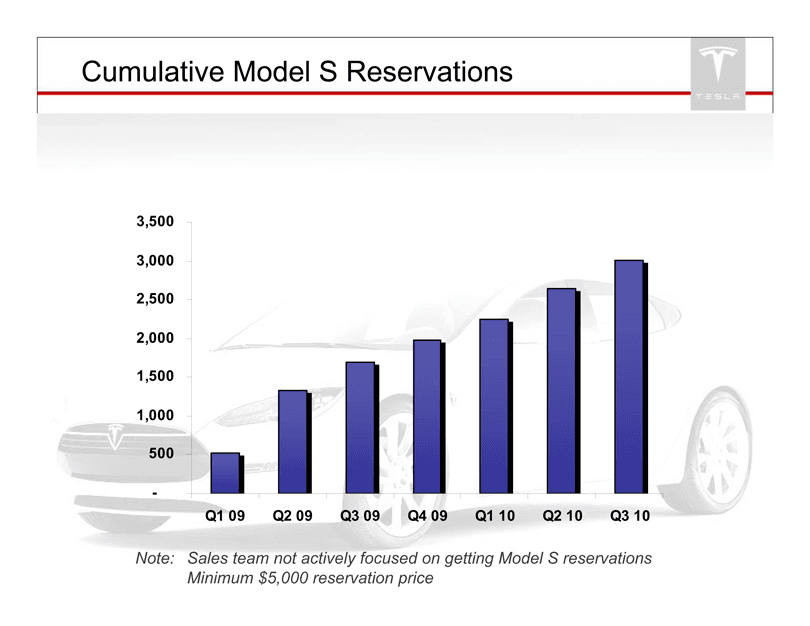
Demand without a sales force is the strongest possible signal. The footnote turns a chart into a story — customers are pulling the product forward.
Slide 11: Platform for broader market opportunity
Common platform chassis diagram — adaptable to sedan, cabriolet, van, and crossover/SUV with shared powertrain and revolutionary packaging.
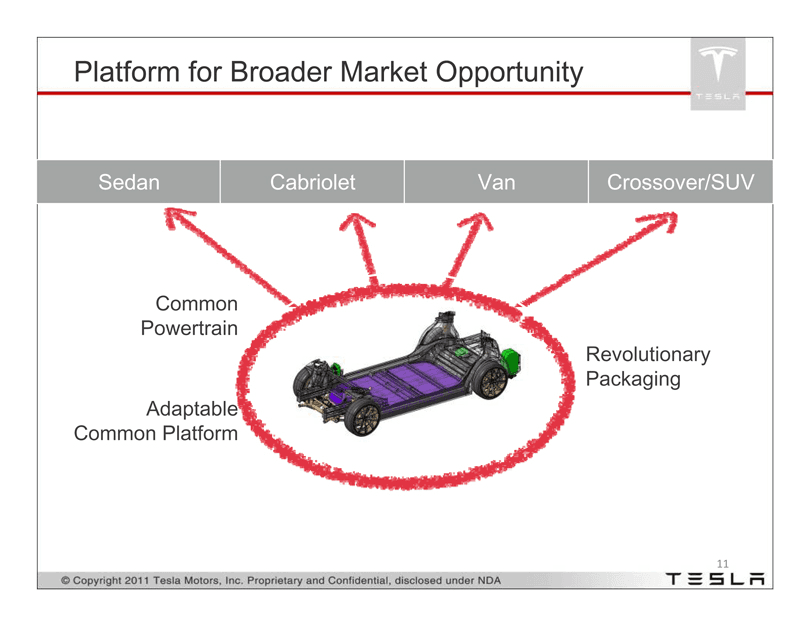
Platform slide answers 'is Model S a one-off?' Red hand-drawn circle on the chassis makes the multi-vehicle roadmap obvious in one glance.
Slide 12: Progressing on Model S
2010–2012 timeline — alpha to beta to production validation on engineering; supplier sourcing through deliveries beginning on manufacturing.
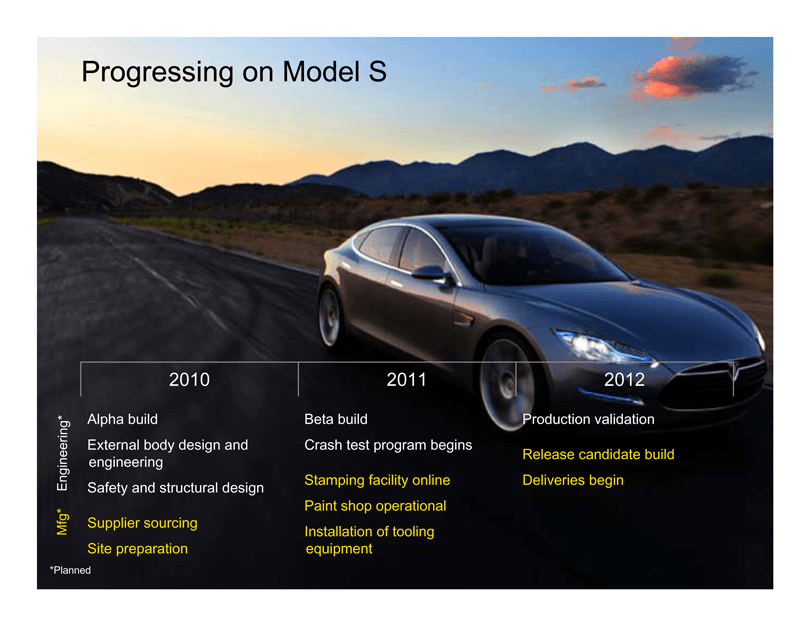
Gantt-style roadmap with Model S hero photo grounds the timeline in a real program. Splitting engineering (white) vs manufacturing (yellow) shows parallel workstreams.
Slide 13: Fremont facility overview
Aerial factory diagram — purchased for $42M, 400K+ unit historical capacity, color-coded Model S and future program zones with shop labels.
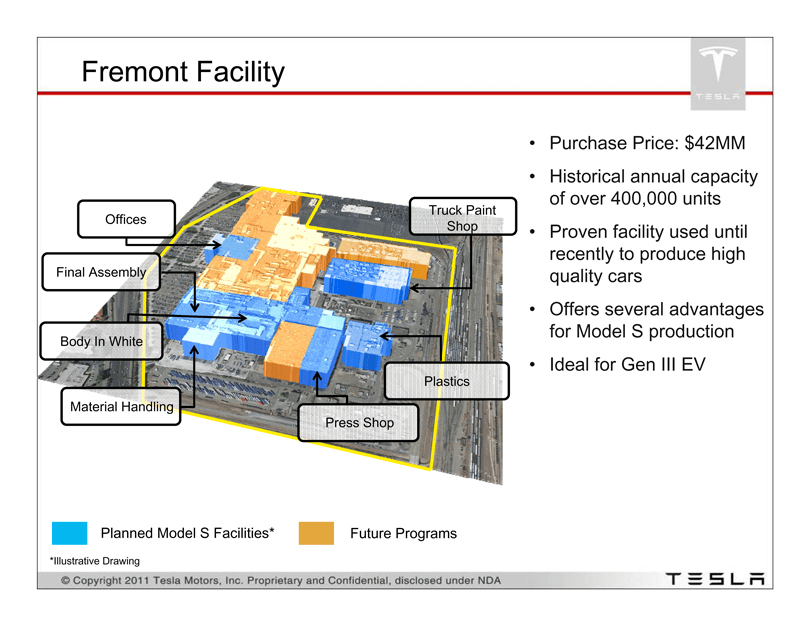
NUMMI acquisition at pennies on the dollar is a valuation argument. Illustrative layout with press shop, paint, and final assembly proves they know what they're buying.
Slide 14: Strategic asset purchases
Photo grid of acquired equipment — 3A and 1B stamping lines, blanking line, 11 cranes, BTR1, car and truck paint facilities.
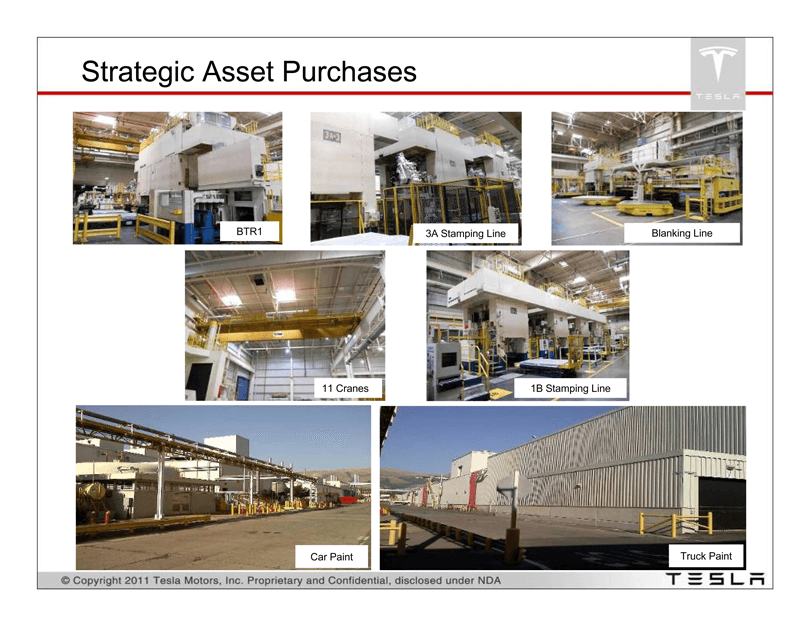
Asset photos turn abstract 'factory purchase' into concrete capability. Investors see stamping and paint infrastructure, not an empty building.
Slide 15: Fremont facility progress
Ownership transfer complete, legacy equipment removal on schedule, supplier plans per shop, manufacturing equipment arriving, prototype builds in 2011.
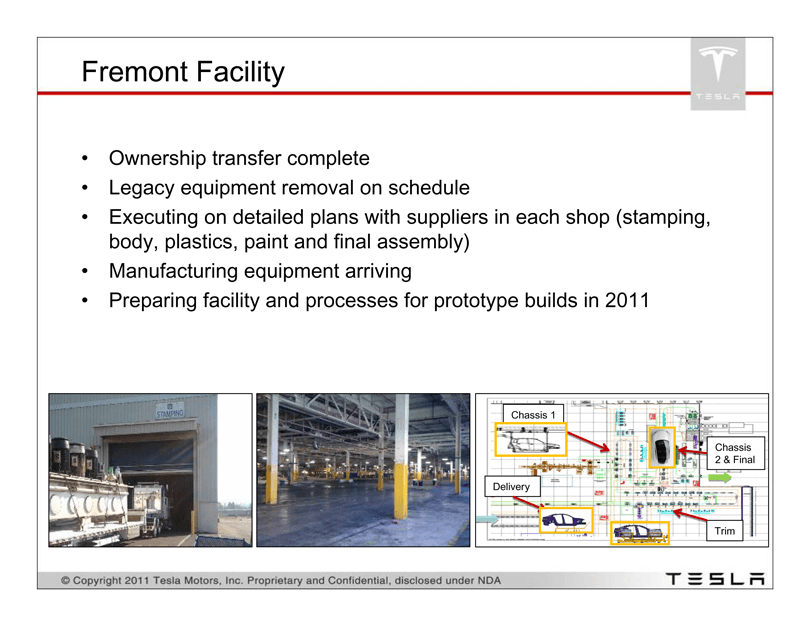
Execution update closes the deck — ownership done, equipment landing, prototype builds next. Stamping exterior photo and empty factory interior show work in progress, not slides.
What this deck teaches founders
- Lead with strategic proof, not product — three partnership slides (Toyota, Panasonic, Daimler) with dollar amounts beat a Roadster photo for late-stage capital.
- Put team early when pedigree is the moat — slide 2 grids twelve executives from Apple, Google, Ford, and Lotus before any car appears.
- Show revenue from partners, not just investment — Daimler's quarterly sales chart and Toyota's $60M development contract turn logos into P&L.
- Let demand charts do the selling — 3,100 Model S reservations with a note that sales was not even pushing hard makes the market feel pulled, not pushed.
- Factory slides justify valuation — $42M for a 400K-unit/year plant plus stamping lines and paint shops show execution capacity investors can underwrite.